

PeakOil is You
We are in a global recession
Re: We are in a global recession
![]() by sjn » Sat 19 Nov 2016, 05:34:40
by sjn » Sat 19 Nov 2016, 05:34:40
Any ideas how they actually measure CO2 emissions ? Do they just subtract known direct non-anthrogenic sources from the global total from satellite sensors? Or is it the output from a model of industrial/economic consumption patterns and efficiency gains? I ask because actual atmospheric CO2 has risen at the highest historical rate (accounting for seasonal variation) during the "stall".
-

sjn - Elite

- Posts: 1332
- Joined: Wed 09 Mar 2005, 04:00:00
- Location: UK
Re: We are in a global recession
![]() by dissident » Sat 19 Nov 2016, 09:24:08
by dissident » Sat 19 Nov 2016, 09:24:08
sjn wrote:Any ideas how they actually measure CO2 emissions ? Do they just subtract known direct non-anthrogenic sources from the global total from satellite sensors? Or is it the output from a model of industrial/economic consumption patterns and efficiency gains? I ask because actual atmospheric CO2 has risen at the highest historical rate (accounting for seasonal variation) during the "stall".
One can calculate the emissions based on the annual increase in CO2 concentrations. It is a well mixed gas so the total amount in the atmosphere is not really hard to determine. The variability of the sinks is slow as well. It is not feasible to measure emissions directly since every chimney stack, biomass burning event, and vehicle needs to be tracked. Of course a detailed estimate of the emissions would require some sort of model for the distribution of CO2 and its sinks in the ocean which depend on temperature. (For example, the current ice free parts of the Arctic Ocean are enhancing CO2 loss).
People always appeal to efficiency to fob off CO2 as a metric of the economy. It reminds me of fusion power, it is always a couple of decades away. So were the 1990s so technologically backward compared to the present? How about most of the 2000s when the CO2 emissions were ramping up from year to year? CO2 emissions grow together with the GDP for obvious reasons. The modern GDP paradigm requires annual growth and no steady state economics regime is being advocated or established.
The graph I posted (thanks to the discussion on one of the climate threads) shows that there was a large increase of GDP between the mid 1990s until the last three years. This is globalization in action and the growth of consumer economies in China, India, and elsewhere. The current stall cannot be attributed to magical new technologies. The scale is all wrong. Solar and wind power are less than 2% of the global energy production. How can such a small number, which was even smaller in 2000, account for the shape of the CO2 emissions curve? It can't.
If someone is going to argue that cars are emitting less CO2 than 20 years ago, I have some prime Florida swamp land for sale that may appeal to them. Average vehicle CO2 emissions have not dropped that much since everyone just needs to drive an SUV and the global car inventory has increased thanks to China and India.
- dissident
- Expert
- Posts: 6458
- Joined: Sat 08 Apr 2006, 03:00:00
Re: We are in a global recession
![]() by dohboi » Sat 19 Nov 2016, 16:33:01
by dohboi » Sat 19 Nov 2016, 16:33:01
In principle, it's easy to measure emissions--just measure output of all ff mines and wells.
It is a fairly safe assumption that nearly all of that gets burned, most within a few months of it coming out of the ground.
The problem with dis's statement that you can measure emissions by concentrations is that the two graphs look quite different, in fact. CO2 concentrations continue to rise at an increasing rate, even as there are claims, such as the graph presented, being made that emissions have not increased markedly over the last couple years.
Whether or not we are currently in a global recession, more and more smart people do seem to be seeing clouds on the horizon, and perhaps much closer: https://www.theguardian.com/money/2016/ ... ?CMP=fb_us
is the next financial crisis on its way?
Steve Eisman saw the last crash coming and was portrayed in an Oscar-winning film. Now he believes Europe’s banks, especially Italy’s, are at risk
-
dohboi - Harmless Drudge

- Posts: 19990
- Joined: Mon 05 Dec 2005, 04:00:00
Re: We are in a global recession
![]() by onlooker » Sat 19 Nov 2016, 18:29:29
by onlooker » Sat 19 Nov 2016, 18:29:29
don't look now but : The Peak & Decline Of International Reserves Warns Of Massive Asset Deflation Ahead'
http://www.zerohedge.com/news/2016-11-1 ... tion-ahead
http://www.zerohedge.com/news/2016-11-1 ... tion-ahead
"We are mortal beings doomed to die
-

onlooker - Fission

- Posts: 10957
- Joined: Sun 10 Nov 2013, 13:49:04
- Location: NY, USA
Re: We are in a global recession
![]() by dissident » Sat 19 Nov 2016, 18:49:37
by dissident » Sat 19 Nov 2016, 18:49:37
dohboi wrote:In principle, it's easy to measure emissions--just measure output of all ff mines and wells.
It is a fairly safe assumption that nearly all of that gets burned, most within a few months of it coming out of the ground.
The problem with dis's statement that you can measure emissions by concentrations is that the two graphs look quite different, in fact. CO2 concentrations continue to rise at an increasing rate, even as there are claims, such as the graph presented, being made that emissions have not increased markedly over the last couple years.
You can't expect them to look similar since one is the time derivative of the other. My point stands.
- dissident
- Expert
- Posts: 6458
- Joined: Sat 08 Apr 2006, 03:00:00
Re: We are in a global recession
![]() by sjn » Sat 19 Nov 2016, 21:16:58
by sjn » Sat 19 Nov 2016, 21:16:58
pstarr wrote:So GW has caused the upcoming final recession?
Joking? The point is CO2 emissions are a proxy for economic activity.
Dis, I think the point Dohboi is making it that the rate of change of CO2 concentration has increased according to the Keeling Curve, whilst emissions have reportedly stalled.
-
sjn - Elite
- Posts: 1332
- Joined: Wed 09 Mar 2005, 04:00:00
- Location: UK
Re: We are in a global recession
![]() by kublikhan » Sat 19 Nov 2016, 21:28:25
by kublikhan » Sat 19 Nov 2016, 21:28:25
If you look at trends in power plant construction you would see why the link between economic growth and co2 emissions is weakening. In decades past, most of our new power plants were powered by fossil fuels. Today, most new power plants are powered by non co2 emitters like renewables, nuclear, etc.dissident wrote:People always appeal to efficiency to fob off CO2 as a metric of the economy. It reminds me of fusion power, it is always a couple of decades away. So were the 1990s so technologically backward compared to the present? How about most of the 2000s when the CO2 emissions were ramping up from year to year? CO2 emissions grow together with the GDP for obvious reasons. The modern GDP paradigm requires annual growth and no steady state economics regime is being advocated or established.
10 YEARS OF RENEWABLE ENERGY PROGRESSIn 2004 the global market share of new renewable-based power plants was only 8%. By 2013 this market share increased to 40% including large hydro.
Renewable energy made up half of world's new power plants in 2014: IEA
Renewables 2016 Global Status Reportkublikhan wrote:Renewable energy highlights 2015:
* Renewable energy investments hit a new record in 2015: $286 billion(excludes large hydro). This was more than double coal & natural gas investments in new capacity for 2015 of $130 billion.
* For the first time in history, total investment in renewable power and fuels in developing countries in 2015 exceeded that in developed economies.
* The world now adds more renewable power capacity annually than it adds (net) capacity from all fossil fuels combined.
* An estimated 147 gigawatts (GW) of renewable power capacity was added in 2015, the largest annual increase ever.
* Wind power was the leading source of new power generating capacity in Europe and the United States in 2015, and the second largest in China.
You are highlighting the growth(or lack thereof) of co2 emissions. Which means you need to look at the growth(or lack there of) of the emission sources. Not the total amount. IE, look at what NEW capacity is being added. Is the new capacity largely fossil fuel based or non fossil fuel based? Look at China for example:dissident wrote:The graph I posted (thanks to the discussion on one of the climate threads) shows that there was a large increase of GDP between the mid 1990s until the last three years. This is globalization in action and the growth of consumer economies in China, India, and elsewhere. The current stall cannot be attributed to magical new technologies. The scale is all wrong. Solar and wind power are less than 2% of the global energy production. How can such a small number, which was even smaller in 2000, account for the shape of the CO2 emissions curve? It can't.
Statistical Communiqué of the People's Republic of China on the 2014 National Economic and Social Developmentkublikhan wrote:China electricity changes 2013-2014 (100 million kWh)
2173 total electricity increase
1444 hydro
646 other(wind, solar, etc.)
210 nuclear
-127 thermal(coal/natural gas)
China saw a large net increase in kwh generated from 2013 to 2014. However thermal generation(coal) actually saw a decrease in generation. However this was more than offset by increases in hydro, nuclear, and other renewable. Thus if you were relying on co2 emissions alone to gauge China's economic growth you might conclude China's economy shrunk. However this would be an erroneous conclusion because net generation actually increased substantially during this time.
The oil barrel is half-full.
-

kublikhan - Master Prognosticator

- Posts: 5024
- Joined: Tue 06 Nov 2007, 04:00:00
- Location: Illinois
Re: We are in a global recession
![]() by dissident » Sat 19 Nov 2016, 22:31:59
by dissident » Sat 19 Nov 2016, 22:31:59
sjn wrote:pstarr wrote:So GW has caused the upcoming final recession?
Joking? The point is CO2 emissions are a proxy for economic activity.
Dis, I think the point Dohboi is making it that the rate of change of CO2 concentration has increased according to the Keeling Curve, whilst emissions have reportedly stalled.
The question is about timescales and imbalances of sources and sinks. Annual variations do not nullify the long term link and it is clear that there CO2 emissions can capture annual variations quite well.
Also, the CO2 concentration is affected by CH4 oxidation and CH4 emissions have been going up. Any model that attempts to determine CO2 emissions needs to take into account other sources of CO2 in the atmosphere aside from direct emissions. Other threads have been discussing the shrinkage of land-based CO2 sinks (e.g. Amazon) so the concentration will reflect that. Again, this does not mean that the emissions curve is meaningless as a metric of economic activity.
- dissident
- Expert
- Posts: 6458
- Joined: Sat 08 Apr 2006, 03:00:00
Re: We are in a global recession
![]() by sjn » Sun 20 Nov 2016, 06:56:46
by sjn » Sun 20 Nov 2016, 06:56:46
Dis, I agree with you, but I am curious about their methodology.
Kub, it's myth that alternatives to fossil fuels do not generate greenhouse gases. Hydro, for example has high CO2 emissions during construction (concrete and heavy equipment), and in most regions very high lifetime CH4 emissions. Nuclear has high emissions during construction, decommissioning and refinement. Solar through the manufacturing process. Wind - manufacture maintenance and especially concrete again.
It's not always clear cut, although almost certainly it's true that typical alt energy sources are better on emissions than the typical fossil fuel plant.
-
sjn - Elite
- Posts: 1332
- Joined: Wed 09 Mar 2005, 04:00:00
- Location: UK
Re: We are in a global recession
![]() by kublikhan » Sun 20 Nov 2016, 14:54:01
by kublikhan » Sun 20 Nov 2016, 14:54:01
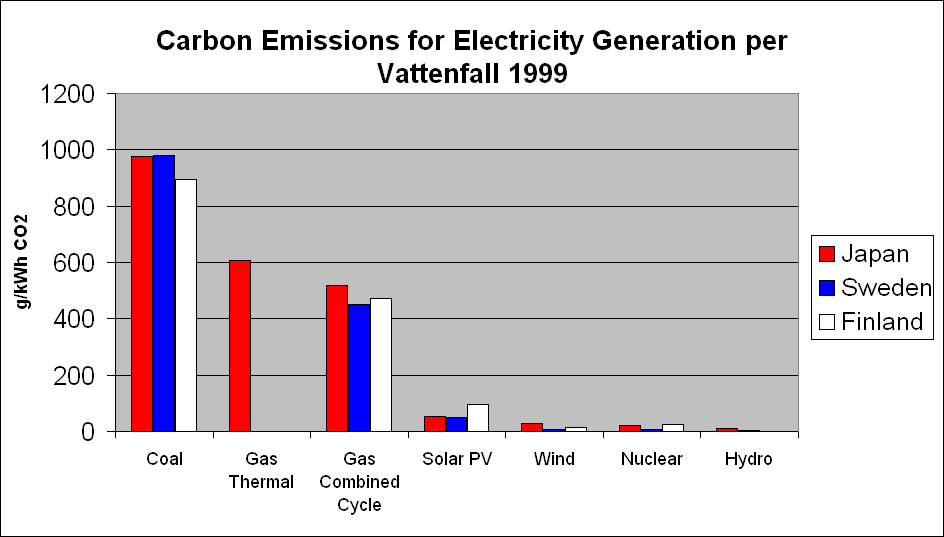
sjn, I am aware renewables generate co2 during construction. However the scale is very different compared to fossil fuels. Renewables add a trickle of co2 emissions compared to fossil fuel sources. And as for methane, that was not in the numbers dissident was discussing. Because of it's methane emissions, hydro in tropical regions may very well contribute more to global warming than coal. However the question was does stalled co2 growth = stalled economic growth. Given the growth of alts combined with the info in the image below, it becomes apparent why the co2/economic link is weakening.sjn wrote:Kub, it's myth that alternatives to fossil fuels do not generate greenhouse gases. Hydro, for example has high CO2 emissions during construction (concrete and heavy equipment), and in most regions very high lifetime CH4 emissions. Nuclear has high emissions during construction, decommissioning and refinement. Solar through the manufacturing process. Wind - manufacture maintenance and especially concrete again.
The oil barrel is half-full.
-
kublikhan - Master Prognosticator
- Posts: 5024
- Joined: Tue 06 Nov 2007, 04:00:00
- Location: Illinois
Re: We are in a global recession
![]() by eugene » Sun 20 Nov 2016, 15:35:14
by eugene » Sun 20 Nov 2016, 15:35:14
Is the glass half full or half empty? This disparity of perceptions will be argued until there's no one left to argue. I figure it depends on agenda, personal fear levels, sheer orneriness and many other factors. All I know is when I look out there, things are getting worse rapidly and for many of the world's poor, who don't have the luxury of arguing, things are going to hell in a hand basket. Personally, I find it scary and if I were younger, terrifying.
- eugene
- Peat

- Posts: 76
- Joined: Sat 23 Aug 2014, 10:08:45
Re: We are in a global recession
![]() by onlooker » Fri 21 Apr 2017, 16:08:20
by onlooker » Fri 21 Apr 2017, 16:08:20
https://www.peakprosperity.com/insider/ ... m=facebook
Off The Cuff: The Era Of Easy Money Is Over
Debt-funded stimulus no longer yields an increase of GDP
Off The Cuff: The Era Of Easy Money Is Over
Debt-funded stimulus no longer yields an increase of GDP
"We are mortal beings doomed to die
-
onlooker - Fission
- Posts: 10957
- Joined: Sun 10 Nov 2013, 13:49:04
- Location: NY, USA
Re: We are in a global recession
![]() by Plantagenet » Fri 21 Apr 2017, 16:16:13
by Plantagenet » Fri 21 Apr 2017, 16:16:13
We are NOT in a global recession. Not right now.
The IMF just raised their economic projection for next year to 3.5% GDP growth.
No doubt sometime in the future there will be another global recession. But we're not in a global recession right now, and IMF projections shows the global economy will be better next year then this year.
The IMF just raised their economic projection for next year to 3.5% GDP growth.
No doubt sometime in the future there will be another global recession. But we're not in a global recession right now, and IMF projections shows the global economy will be better next year then this year.
-

Plantagenet - Expert
- Posts: 26662
- Joined: Mon 09 Apr 2007, 03:00:00
- Location: Alaska (its much bigger than Texas).
Re: We are in a global recession
![]() by Plantagenet » Fri 21 Apr 2017, 17:11:22
by Plantagenet » Fri 21 Apr 2017, 17:11:22
pstarr wrote: Plant, have you turned your back on your beloved Ayn Rand?
?????
I'm not a fan of Ayn Rand. I've made over 12,000 posts here and never once mentioned her.
OH I get it. Peter's been dabbing again and he's stoned out of his mind.
And when Peter gets stoned he has wacko fantasies about .... of all people Ayn Rand!

Hahahahahaahahahah!
Cheers!

If its friday Peter must be stoned. This time he is so stoned he is having pot dream about Ayn Rand----
![[smilie=5hypnodisk.gif]](https://www.peakoil.com/forums/images/smilies/5hypnodisk.gif "5hypnodisk")
![[smilie=5shocking.gif]](https://www.peakoil.com/forums/images/smilies/5shocking.gif "5shocking")
![[smilie=5sonar.gif]](https://www.peakoil.com/forums/images/smilies/5sonar.gif "5sonar")
![[smilie=5propeller.gif]](https://www.peakoil.com/forums/images/smilies/5propeller.gif "5propeller")
![[smilie=angel4.gif]](https://www.peakoil.com/forums/images/smilies/angel4.gif "angel4")
![[smilie=drunken_smilie.gif]](https://www.peakoil.com/forums/images/smilies/drunken_smilie.gif "drunken_smilie")
-
Plantagenet - Expert
- Posts: 26662
- Joined: Mon 09 Apr 2007, 03:00:00
- Location: Alaska (its much bigger than Texas).
Who is online
Users browsing this forum: No registered users and 9 guests