

PeakOil is You
were can i get some reliable graphs of world oil production
First unread post • 16 posts
• Page 1 of 1
were can i get some reliable graphs of world oil production
![]() by energyhoggin » Tue 14 Jul 2009, 23:41:19
by energyhoggin » Tue 14 Jul 2009, 23:41:19
Every site i checked into has a different graph or numbers representing oil production, most sites agree on past production but not on current production. Sites i checked into was wikipedia, oil drum, cia world factbook, international energy data and analysis, and american petroleum institute. How do these sites even get their data, i mean do they count the number of tankers going out, monitor the stock market, and etc. If peak oil were to hit how would we even know without reliable data?
Fact: There will be a limit to growth
- energyhoggin
- Wood

- Posts: 43
- Joined: Wed 03 Jun 2009, 16:51:55
Re: were can i get some reliable graphs of world oil production
![]() by copious.abundance » Tue 14 Jul 2009, 23:44:52
by copious.abundance » Tue 14 Jul 2009, 23:44:52
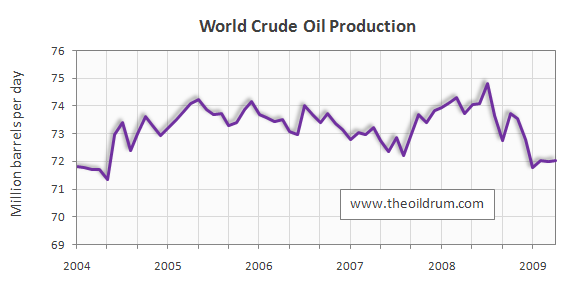
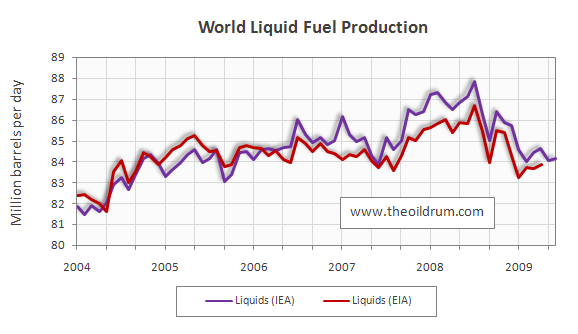
http://europe.theoildrum.com/node/5571
Notice it has different numbers for the EIA and the IEA.
Don't think there's such a thing as a "perfect" oil production figure.
Stuff for doomers to contemplate:
http://peakoil.com/forums/post1190117.html#p1190117
http://peakoil.com/forums/post1193930.html#p1193930
http://peakoil.com/forums/post1206767.html#p1206767
http://peakoil.com/forums/post1190117.html#p1190117
http://peakoil.com/forums/post1193930.html#p1193930
http://peakoil.com/forums/post1206767.html#p1206767
-

copious.abundance - Fission

- Posts: 9589
- Joined: Wed 26 Mar 2008, 03:00:00
- Location: Cornucopia
Re: were can i get some reliable graphs of world oil production
![]() by copious.abundance » Tue 14 Jul 2009, 23:50:32
by copious.abundance » Tue 14 Jul 2009, 23:50:32
BTW I noticed Rembrandt added nifty drop shadows to his graphs in Oilwatch Monthly this month. 
Stuff for doomers to contemplate:
http://peakoil.com/forums/post1190117.html#p1190117
http://peakoil.com/forums/post1193930.html#p1193930
http://peakoil.com/forums/post1206767.html#p1206767
http://peakoil.com/forums/post1190117.html#p1190117
http://peakoil.com/forums/post1193930.html#p1193930
http://peakoil.com/forums/post1206767.html#p1206767
-
copious.abundance - Fission
- Posts: 9589
- Joined: Wed 26 Mar 2008, 03:00:00
- Location: Cornucopia
Re: were can i get some reliable graphs of world oil production
![]() by eastbay » Wed 15 Jul 2009, 00:30:10
by eastbay » Wed 15 Jul 2009, 00:30:10
I love that chart because it clearly demonstrates for all that, with the exception of a final powerful squeeze in 2008, world oil production peaked in 2005. Four years ago.
It's downhill from now on. With an exception here and there as the 'bumpy plateau' is plotted over time, it's a general decline from here on in.
If you can't find what you're looking for here, for additional detailed graphs try theoildrum.
It's downhill from now on. With an exception here and there as the 'bumpy plateau' is plotted over time, it's a general decline from here on in.
If you can't find what you're looking for here, for additional detailed graphs try theoildrum.
Got Dharma?
Everything is Impermanent. Shakyamuni Buddha
Everything is Impermanent. Shakyamuni Buddha
-

eastbay - Expert

- Posts: 7186
- Joined: Sat 18 Dec 2004, 04:00:00
- Location: One Mile From the Columbia River
Re: were can i get some reliable graphs of world oil production
![]() by energyhoggin » Wed 15 Jul 2009, 01:33:33
by energyhoggin » Wed 15 Jul 2009, 01:33:33
whoa, i wonder if the drop is from opec cutting production or peak production
Fact: There will be a limit to growth
- energyhoggin
- Wood
- Posts: 43
- Joined: Wed 03 Jun 2009, 16:51:55
does it matter?
![]() by miraculix » Wed 15 Jul 2009, 04:11:03
by miraculix » Wed 15 Jul 2009, 04:11:03
Production declines at this point are market driven - read "demand destruction"
My understanding of the peak is the fact that upstream production was constrained by the infrastructure in place in 2008. Basically, the industry was firing on all cylinders to crank out that peak flow.
Now that investment in infrastructure has receded substantially, we will bump against that ceiling that much quicker any time demand and/or price signals an uptick.
I venture to say, that the geoligically available resource base is only a second order variable. Peak production is governed by above ground factors.
Hence, the 2008 production peak will mark the inflection point of the peak oil curve.
Probably ten years down the road we will have confirmation of that fact.
As to the different production charts, it is irrelevant if one states 74 mbl and another shows 72 mbl. It is in the same ballpark.
-

miraculix - Peat
- Posts: 158
- Joined: Tue 11 Apr 2006, 03:00:00
Re: were can i get some reliable graphs of world oil production
![]() by copious.abundance » Wed 15 Jul 2009, 13:09:02
by copious.abundance » Wed 15 Jul 2009, 13:09:02
eastbay wrote:I love that chart because it clearly demonstrates for all that, with the exception of a final powerful squeeze in 2008, world oil production peaked in 2005. Four years ago.
It's downhill from now on. With an exception here and there as the 'bumpy plateau' is plotted over time, it's a general decline from here on in.
If you can't find what you're looking for here, for additional detailed graphs try theoildrum.
Here is your 4-year "bumpy plateau" in its proper, long-term perspective. Looks a lot like the 4-year "bumpy plateau" from about 1990 to about 1995.

And of course it's nothing compared to the drop-off in the late 70's - early 80's.
Stuff for doomers to contemplate:
http://peakoil.com/forums/post1190117.html#p1190117
http://peakoil.com/forums/post1193930.html#p1193930
http://peakoil.com/forums/post1206767.html#p1206767
http://peakoil.com/forums/post1190117.html#p1190117
http://peakoil.com/forums/post1193930.html#p1193930
http://peakoil.com/forums/post1206767.html#p1206767
-
copious.abundance - Fission
- Posts: 9589
- Joined: Wed 26 Mar 2008, 03:00:00
- Location: Cornucopia
Re: were can i get some reliable graphs of world oil production
![]() by eastbay » Wed 15 Jul 2009, 13:15:57
by eastbay » Wed 15 Jul 2009, 13:15:57
Yes, take that climbing red line, flip it around to the right, and one gets a complete little bumpy bell curve. We're now on top. The newly created side on the right is the one we're about to start sliding down.
Got Dharma?
Everything is Impermanent. Shakyamuni Buddha
Everything is Impermanent. Shakyamuni Buddha
-
eastbay - Expert
- Posts: 7186
- Joined: Sat 18 Dec 2004, 04:00:00
- Location: One Mile From the Columbia River
Re: were can i get some reliable graphs of world oil production
![]() by energyhoggin » Sun 26 Jul 2009, 19:25:52
by energyhoggin » Sun 26 Jul 2009, 19:25:52
OilFinder2 wrote:eastbay wrote:I love that chart because it clearly demonstrates for all that, with the exception of a final powerful squeeze in 2008, world oil production peaked in 2005. Four years ago.
It's downhill from now on. With an exception here and there as the 'bumpy plateau' is plotted over time, it's a general decline from here on in.
If you can't find what you're looking for here, for additional detailed graphs try theoildrum.
Here is your 4-year "bumpy plateau" in its proper, long-term perspective. Looks a lot like the 4-year "bumpy plateau" from about 1990 to about 1995.
And of course it's nothing compared to the drop-off in the late 70's - early 80's.
the 90s drop was caused by the .com bubble, after that recession oil plummeted to an all time low i doubt it will go down after the recession we are in now but we shall see
Fact: There will be a limit to growth
- energyhoggin
- Wood
- Posts: 43
- Joined: Wed 03 Jun 2009, 16:51:55
Re: were can i get some reliable graphs of world oil production
![]() by vision-master » Sun 26 Jul 2009, 19:37:16
by vision-master » Sun 26 Jul 2009, 19:37:16
OilFinder2 wrote:
http://europe.theoildrum.com/node/5571
Notice it has different numbers for the EIA and the IEA.
Don't think there's such a thing as a "perfect" oil production figure.
2008 was the last spurt.

- vision-master
Re: were can i get some reliable graphs of world oil production
![]() by copious.abundance » Sun 26 Jul 2009, 21:09:26
by copious.abundance » Sun 26 Jul 2009, 21:09:26
energyhoggin wrote:OilFinder2 wrote:Here is your 4-year "bumpy plateau" in its proper, long-term perspective. Looks a lot like the 4-year "bumpy plateau" from about 1990 to about 1995.
And of course it's nothing compared to the drop-off in the late 70's - early 80's.
the 90s drop was caused by the .com bubble, after that recession oil plummeted to an all time low i doubt it will go down after the recession we are in now but we shall see
Umm, the dot-com bubble burst from 1999 to 2002. The 1990-1995 range I cited was one in which the economy had started growing (at least starting in 1992 or so). In other words, oil production remained flat for a few years after the economy had started growing.
Stuff for doomers to contemplate:
http://peakoil.com/forums/post1190117.html#p1190117
http://peakoil.com/forums/post1193930.html#p1193930
http://peakoil.com/forums/post1206767.html#p1206767
http://peakoil.com/forums/post1190117.html#p1190117
http://peakoil.com/forums/post1193930.html#p1193930
http://peakoil.com/forums/post1206767.html#p1206767
-
copious.abundance - Fission
- Posts: 9589
- Joined: Wed 26 Mar 2008, 03:00:00
- Location: Cornucopia
Re: were can i get some reliable graphs of world oil production
![]() by copious.abundance » Mon 27 Jul 2009, 15:28:33
by copious.abundance » Mon 27 Jul 2009, 15:28:33
pstarr wrote:He is a paid shill for the extractive resource industry .
This has become so lame it isn't funny.
Sure, I wish someone would pay me to post here. The extra money would be great!

Stuff for doomers to contemplate:
http://peakoil.com/forums/post1190117.html#p1190117
http://peakoil.com/forums/post1193930.html#p1193930
http://peakoil.com/forums/post1206767.html#p1206767
http://peakoil.com/forums/post1190117.html#p1190117
http://peakoil.com/forums/post1193930.html#p1193930
http://peakoil.com/forums/post1206767.html#p1206767
-
copious.abundance - Fission
- Posts: 9589
- Joined: Wed 26 Mar 2008, 03:00:00
- Location: Cornucopia
Re: were can i get some reliable graphs of world oil production
![]() by spot5050 » Tue 28 Jul 2009, 20:08:44
by spot5050 » Tue 28 Jul 2009, 20:08:44
Hi energyhoggin, the UK Gov. Department of Energy publish data that should be as reliable as any.
This is their chart for "UK Oil Production 1975 to Present".

https://www.og.decc.gov.uk/pprs/full_production/monthly+oil+production/0.htm
They also publish charts for gas and I think coal too.
This is their chart for "UK Oil Production 1975 to Present".
https://www.og.decc.gov.uk/pprs/full_production/monthly+oil+production/0.htm
They also publish charts for gas and I think coal too.
- spot5050
- Tar Sands

- Posts: 518
- Joined: Tue 07 Dec 2004, 04:00:00
- Location: Cheshire, England
Re: were can i get some reliable graphs of world oil production
![]() by TheDude » Tue 28 Jul 2009, 20:55:26
by TheDude » Tue 28 Jul 2009, 20:55:26
OilFinder2 wrote:Here is your 4-year "bumpy plateau" in its proper, long-term perspective. Looks a lot like the 4-year "bumpy plateau" from about 1990 to about 1995.
1990-95 world production grew 3.9%, from 2004-2008 1.9%.
Spreadsheet - Wikipedia, the free encyclopedia
Cogito, ergo non satis bibivi
And let me tell you something: I dig your work.
And let me tell you something: I dig your work.
-

TheDude - Expert
- Posts: 4896
- Joined: Thu 06 Apr 2006, 03:00:00
- Location: 3 miles NW of Champoeg, Republic of Cascadia
Re: were can i get some reliable graphs of world oil production
![]() by copious.abundance » Tue 28 Jul 2009, 22:39:37
by copious.abundance » Tue 28 Jul 2009, 22:39:37
TheDude wrote:OilFinder2 wrote:Here is your 4-year "bumpy plateau" in its proper, long-term perspective. Looks a lot like the 4-year "bumpy plateau" from about 1990 to about 1995.
1990-95 world production grew 3.9%, from 2004-2008 1.9%.
Spreadsheet - Wikipedia, the free encyclopedia
If I had known someone would have suggested I get so detailed so as to pull out a spreadsheet instead of just glancing at the graph, I would have said 1990-1994, which would match the same 4 years as 2004-2008. But when I said "about" in front of each year I guess someone didn't notice.
So, here you go - same number of years for each:
Using the "Crude Oil, NGPL, and Other Liquids" selection, and selecting the correct years . . .
1990 all-liquids production - 65,473.062 bpd
1994 all-liquids production - 67,283.297 bpd
A 2.8% increase
2004 all-liquids production - 80,965.918 bpd
2008 all-liquids production - 83,370.844 bpd
A 3.0% increase
Source: EIA.
Sorry, try again. The production increase was greater during the 4 years from 2004-2008 than from 1990-1994.
Stuff for doomers to contemplate:
http://peakoil.com/forums/post1190117.html#p1190117
http://peakoil.com/forums/post1193930.html#p1193930
http://peakoil.com/forums/post1206767.html#p1206767
http://peakoil.com/forums/post1190117.html#p1190117
http://peakoil.com/forums/post1193930.html#p1193930
http://peakoil.com/forums/post1206767.html#p1206767
-
copious.abundance - Fission
- Posts: 9589
- Joined: Wed 26 Mar 2008, 03:00:00
- Location: Cornucopia
16 posts
• Page 1 of 1
Who is online
Users browsing this forum: No registered users and 14 guests