

PeakOil is You
Looking for up-to-date global oil production data
Looking for up-to-date global oil production data
![]() by Anders » Tue 18 May 2010, 11:14:44
by Anders » Tue 18 May 2010, 11:14:44
- Anders
- Peat

- Posts: 56
- Joined: Mon 17 May 2010, 19:06:30
Re: Looking for up-to-date global oil production data
![]() by Anders » Tue 18 May 2010, 11:36:10
by Anders » Tue 18 May 2010, 11:36:10
From: http://earlywarn.blogspot.com/2010/05/l ... stics.html
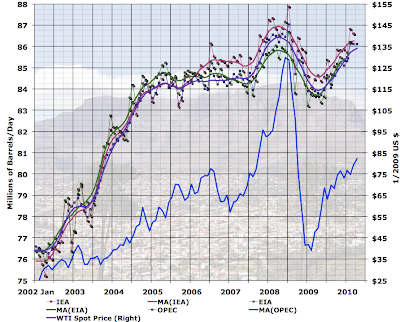
Notice the truncated scale for the production (75 - 88 mbd) which makes the graph look like it's moving up and down a lot, but in reality the global oil production has remained basically flat (around 84 - 86 mbd). Also, the correlation between production and price is less than it might seem according to this chart. A steep price drop from $147 to $40 a barrel only altered the global oil production by around 3 mbd.
- Anders
- Peat
- Posts: 56
- Joined: Mon 17 May 2010, 19:06:30
Re: Looking for up-to-date global oil production data
![]() by Anders » Tue 18 May 2010, 11:54:04
by Anders » Tue 18 May 2010, 11:54:04
- Anders
- Peat
- Posts: 56
- Joined: Mon 17 May 2010, 19:06:30
Re: Looking for up-to-date global oil production data
![]() by Pops » Tue 18 May 2010, 12:50:12
by Pops » Tue 18 May 2010, 12:50:12
I can't take time right now to look up citations but US consumers were way ahead of wall street and had already started pulling back before that peak and the bank bust. Further, lots of scared money was leaving real estate and along with demand from Chindia's crazy-growth, commodities of all sorts were hot - including oil.
What it tells me is that consumption is pretty elastic after all - high prices (maybe US $100+) = fewer jobs = less demand.
-- Abraham Lincoln, Fragment on Government (July 1, 1854)
-

Pops - Elite

- Posts: 19746
- Joined: Sat 03 Apr 2004, 04:00:00
- Location: QuikSac for a 6-Pac
Re: Looking for up-to-date global oil production data
![]() by Anders » Tue 18 May 2010, 13:16:49
by Anders » Tue 18 May 2010, 13:16:49
Pops wrote:It isn't moving very much in historical terms, ...
I can't take time right now to look up citations but US consumers were way ahead of wall street and had already started pulling back before that peak and the bank bust. Further, lots of scared money was leaving real estate and along with demand from Chindia's crazy-growth, commodities of all sorts were hot - including oil.
What it tells me is that consumption is pretty elastic after all - high prices (maybe US $100+) = fewer jobs = less demand.
Ok, yeah the price is not the only thing that determines production. Demand is also a needed factor.
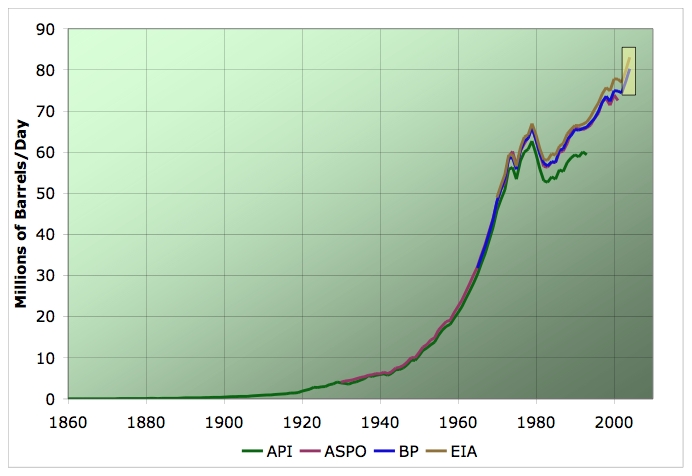
Interesting exponential chart from 1900 to 1980. It's definitely some kind of plateau that has been reached in global oil production the recent years. It will be interesting to see how the global production will fluctuate in the near future.
- Anders
- Peat
- Posts: 56
- Joined: Mon 17 May 2010, 19:06:30
Re: Looking for up-to-date global oil production data
![]() by Anders » Tue 18 May 2010, 14:42:16
by Anders » Tue 18 May 2010, 14:42:16


- Anders
- Peat
- Posts: 56
- Joined: Mon 17 May 2010, 19:06:30
Re: Looking for up-to-date global oil production data
![]() by misterno » Tue 18 May 2010, 15:24:06
by misterno » Tue 18 May 2010, 15:24:06
Anders wrote:Another observation that can be made from the chart is that the production peak around 2008 actually happened before the peak in price. I'm not an expert but that could be significant. If the price was the dominant factor in determining total production, then the production should have continued to increase along with the price increasing. But it didn't! That to me indicates that the maximum production capacity had been reached at that point, and further increase in price could no longer keep determining the production rate. Of course, this may be a way too simplistic analysis, so some experts would probably have to look at it to really determine the reason for the early production peak.
you are wrong
the reason the oıl productıon dıd not go up as much as the prıce ıs because the producers could not fınd enough storage place to store extra productıon.
Please remember the saudı oıl mınıster's comment on thıs sıtuatıon. He saıd they fılled a tanker wıth oıl when the prıce was around $140/barrel and no one was bothered to buy ıt although ıt was prıced same as the market.
Thıs ıs tellıng me that the huge run up ın the prıce was purely speculatıve not because of excess demand.
Keep ın mınd that there ıs paper demand and there ıs physıcal demand. No one knows whıch one ıs larger than the other. If I knew I would be the rıchest person ın the world.
-

misterno - Tar Sands

- Posts: 843
- Joined: Wed 07 Mar 2007, 04:00:00
- Location: Somewhere super boring
Re: Looking for up-to-date global oil production data
![]() by GoghGoner » Tue 18 May 2010, 16:05:00
by GoghGoner » Tue 18 May 2010, 16:05:00
misterno wrote:the reason the oıl productıon dıd not go up as much as the prıce ıs because the producers could not fınd enough storage place to store extra productıon.
Please remember the saudı oıl mınıster's comment on thıs sıtuatıon. He saıd they fılled a tanker wıth oıl when the prıce was around $140/barrel and no one was bothered to buy ıt although ıt was prıced same as the market.
Thıs ıs tellıng me that the huge run up ın the prıce was purely speculatıve not because of excess demand.
Why is this comment by the oil minister true? Many other comments by this group have been shown to be false. To believe this comment, you would have to believe that markets do not function at all.
- GoghGoner
- Heavy Crude

- Posts: 1827
- Joined: Thu 10 Apr 2008, 03:00:00
- Location: Stilłwater subdivision
Re: Looking for up-to-date global oil production data
![]() by Anders » Tue 18 May 2010, 16:18:46
by Anders » Tue 18 May 2010, 16:18:46
misterno wrote:you are wrong
the reason the oıl productıon dıd not go up as much as the prıce ıs because the producers could not fınd enough storage place to store extra productıon.
Please remember the saudı oıl mınıster's comment on thıs sıtuatıon. He saıd they fılled a tanker wıth oıl when the prıce was around $140/barrel and no one was bothered to buy ıt although ıt was prıced same as the market.
Thıs ıs tellıng me that the huge run up ın the prıce was purely speculatıve not because of excess demand.
Keep ın mınd that there ıs paper demand and there ıs physıcal demand. No one knows whıch one ıs larger than the other. If I knew I would be the rıchest person ın the world.
Ok, but one thing I find strange is that the economic growth in the world during the 20th century matches an exponential oil production increase. And in the 21th century that economic growth has continued and even increased a lot for very large countries like India and China. So there must as I see it exist a huge demand for oil globally. And that the plateau we have seen from around 2005 is in fact a result of a decline in actual oil reserves.
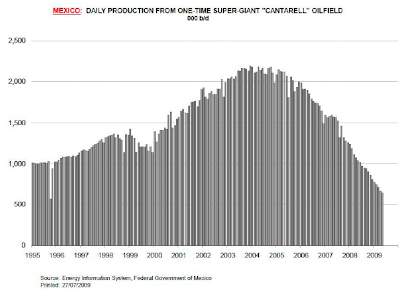
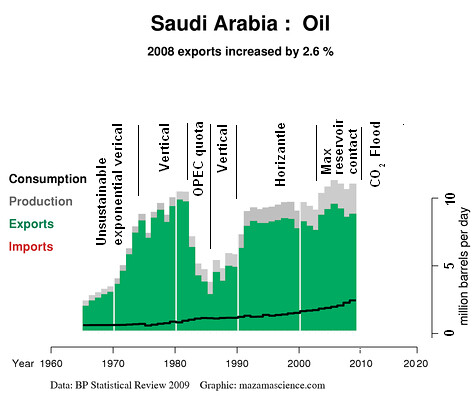
For example, Saudi Arabia has tripled their number of oil rigs the last few years, yet still barely been able to keep their oil production at the same level. The huge Cantarell field in Mexico has gone into a decline (that was hardly affected at all even when the price went to $147 and then down to $40 a barrel). So there seems to be a geological reality that is the cause of the global oil production having reached a plateau, rather than price or demand or infrastructure issues.
- Anders
- Peat
- Posts: 56
- Joined: Mon 17 May 2010, 19:06:30
Re: Looking for up-to-date global oil production data
![]() by GoghGoner » Tue 18 May 2010, 16:32:01
by GoghGoner » Tue 18 May 2010, 16:32:01
TheOilDrum posted the oil watch monthly today -- lots of good historical graphs to ponder each and every month!
- GoghGoner
- Heavy Crude
- Posts: 1827
- Joined: Thu 10 Apr 2008, 03:00:00
- Location: Stilłwater subdivision
Re: Looking for up-to-date global oil production data
![]() by Anders » Tue 18 May 2010, 16:48:30
by Anders » Tue 18 May 2010, 16:48:30
GoghGoner wrote:Anders, that graph is all liquids so it includes stuff like ethanol. It would be better to stick with conventional crude graphs, imo.
TheOilDrum posted the oil watch monthly today -- lots of good historical graphs to ponder each and every month!
Yes, I found a chart showing the global oil production up to 2009 posted on TheOilDrum if I remember correctly. I wanted more recent data. And the chart I posted was from a blog post with the title Latest Global Oil Production Statistics, and judging by the y-axis it says Millions of Barrels/Day and on the right side it's obviously the price of crude oil that is indicated, so I don't think ethanol is included in that.
In the other graph, ethanol may be included, I don't know, but ethanol production was negligible compared with oil during the 20th century, was it not?
- Anders
- Peat
- Posts: 56
- Joined: Mon 17 May 2010, 19:06:30
Re: Looking for up-to-date global oil production data
![]() by Anders » Tue 18 May 2010, 16:57:30
by Anders » Tue 18 May 2010, 16:57:30
Another interesting thing with the above chart is that the graph is very smoothly exponential up to the early 70s. What happened at that point in time? U.S. oil production peaked in the early 70s! And after that time the curve is more linear than exponential.
- Anders
- Peat
- Posts: 56
- Joined: Mon 17 May 2010, 19:06:30
Re: Looking for up-to-date global oil production data
![]() by Anders » Tue 18 May 2010, 17:01:29
by Anders » Tue 18 May 2010, 17:01:29
Anders wrote: ...
For example, Saudi Arabia has tripled their number of oil rigs the last few years, yet still barely been able to keep their oil production at the same level. The huge Cantarell field in Mexico has gone into a decline (that was hardly affected at all even when the price went to $147 and then down to $40 a barrel). So there seems to be a geological reality that is the cause of the global oil production having reached a plateau, rather than price or demand or infrastructure issues.

- Anders
- Peat
- Posts: 56
- Joined: Mon 17 May 2010, 19:06:30
Re: Looking for up-to-date global oil production data
![]() by Pops » Tue 18 May 2010, 17:22:43
by Pops » Tue 18 May 2010, 17:22:43
Anders wrote: And that the plateau we have seen from around 2005 is in fact a result of a decline in actual oil reserves.
Any time oil is extracted, reserve numbers should go down, anytime new fields are found and explored the reserve numbers (which are only estimates) should go up. A decline (or increase) in production doesn't tell you anything about reserves, they are two different things.
Go to BP's site and click on the charting tool. It will show somewhere around 40 years of reserves at current production levels, which is where they have stayed for 20 years - or is it 30?
-- Abraham Lincoln, Fragment on Government (July 1, 1854)
-
Pops - Elite
- Posts: 19746
- Joined: Sat 03 Apr 2004, 04:00:00
- Location: QuikSac for a 6-Pac
Re: Looking for up-to-date global oil production data
![]() by Pops » Tue 18 May 2010, 17:42:05
by Pops » Tue 18 May 2010, 17:42:05
Anders wrote: U.S. oil production peaked in the early 70s! And after that time the curve is more linear than exponential.
Yes, the US had to begin importing more oil so OPEC began to have a hand in setting export amounts which of course they tried to restrict to keep a floor under the price.
People actually started thinking about things like insulation and whether it was a good idea to buy that 500cid. Caddie so demand softened some. Actually demand per capita for oil has stayed flat for some time, since you are a chart guy, here is my favorite chart:

That is an updated chart first put out by Richard Duncan, formerly of Olduvai Gorge, check out DieOff.org
-- Abraham Lincoln, Fragment on Government (July 1, 1854)
-
Pops - Elite
- Posts: 19746
- Joined: Sat 03 Apr 2004, 04:00:00
- Location: QuikSac for a 6-Pac
Re: Looking for up-to-date global oil production data
![]() by GoghGoner » Tue 18 May 2010, 17:45:59
by GoghGoner » Tue 18 May 2010, 17:45:59
- GoghGoner
- Heavy Crude
- Posts: 1827
- Joined: Thu 10 Apr 2008, 03:00:00
- Location: Stilłwater subdivision
Re: Looking for up-to-date global oil production data
![]() by Anders » Tue 18 May 2010, 17:57:39
by Anders » Tue 18 May 2010, 17:57:39
Pops wrote:Anders wrote: And that the plateau we have seen from around 2005 is in fact a result of a decline in actual oil reserves.
Any time oil is extracted, reserve numbers should go down, anytime new fields are found and explored the reserve numbers (which are only estimates) should go up. A decline (or increase) in production doesn't tell you anything about reserves, they are two different things.
Go to BP's site and click on the charting tool. It will show somewhere around 40 years of reserves at current production levels, which is where they have stayed for 20 years - or is it 30?
If I remember correctly, someone said that the finding of new reserves peaked in the mid 60s, and after that it has been a steady overall decline in how much reserves are left. Plus the more depleted oil wells/fields become, the harder it is to extract the oil and things like CO2 and steam injection are needed. Also, Saudi Arabia and other nations have claimed to have proven reserves that some experts doubt are correct figures.
- Anders
- Peat
- Posts: 56
- Joined: Mon 17 May 2010, 19:06:30
Re: Looking for up-to-date global oil production data
![]() by Pops » Tue 18 May 2010, 19:18:13
by Pops » Tue 18 May 2010, 19:18:13
Anders wrote:If I remember correctly, someone said that the finding of new reserves peaked in the mid 60s, and after that it has been a steady overall decline in how much reserves are left.
That's close, after discoveries peaked, there has been a decline in discoveries. But like I mentioned, the reserves to production ratio increased until 1987 and has been relatively flat at around 42 years of reserves since.
Of course those are stated reserves, stated by businesses and countries with many reasons to not be entirely forthcoming. Additionally, since they are only estimates of the ultimately recoverable amount of oil in the ground at a certain point in time, reserves can change with changes in technology, the value of the oil, any number of things. What might not have been worth going after at $15 might be perfectly profitable at $50.
Seriously, take a look at the BP charting tool, it's pretty cool and the closest thing we mortals have to getting an idea of the overall picture.
-- Abraham Lincoln, Fragment on Government (July 1, 1854)
-
Pops - Elite
- Posts: 19746
- Joined: Sat 03 Apr 2004, 04:00:00
- Location: QuikSac for a 6-Pac
Re: Looking for up-to-date global oil production data
![]() by Anders » Tue 18 May 2010, 23:44:29
by Anders » Tue 18 May 2010, 23:44:29
Pops wrote:Anders wrote:If I remember correctly, someone said that the finding of new reserves peaked in the mid 60s, and after that it has been a steady overall decline in how much reserves are left.
That's close, after discoveries peaked, there has been a decline in discoveries. But like I mentioned, the reserves to production ratio increased until 1987 and has been relatively flat at around 42 years of reserves since.
Of course those are stated reserves, stated by businesses and countries with many reasons to not be entirely forthcoming. Additionally, since they are only estimates of the ultimately recoverable amount of oil in the ground at a certain point in time, reserves can change with changes in technology, the value of the oil, any number of things. What might not have been worth going after at $15 might be perfectly profitable at $50.
Seriously, take a look at the BP charting tool, it's pretty cool and the closest thing we mortals have to getting an idea of the overall picture.
I looked at the BP charting tool. Can be useful.
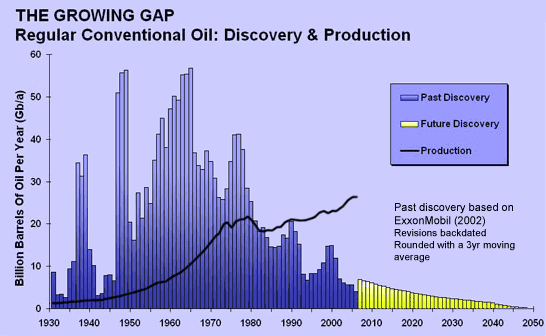
As for oil reserves, I believe the situation is more like as presented in this chart:
- Anders
- Peat
- Posts: 56
- Joined: Mon 17 May 2010, 19:06:30
Re: Looking for up-to-date global oil production data
![]() by shortonsense » Wed 19 May 2010, 00:16:00
by shortonsense » Wed 19 May 2010, 00:16:00
Anders wrote:As for oil reserves, I believe the situation is more like as presented in this chart:
While this famous (and censored) chart is interesting, I believe it is quite misleading.
For example, lets go back to 1975 or so. See those spikes in the late 1930's or so? Thats basically Ghawar. In 1975 the height of those 3 bars wouldn't be where they are now ( approx 30-35 bboe ), they would be more like 20 bboe or so. The reason for this is that the best estimates of Ghawar in 1975 were much smaller. Nowadays, the known size of Ghawar is much larger. By continually backdating these changes in size, the overall shape of this graph remains the same, and its very difficult to notice that those bars just keep getting taller and taller as time goes on. Certainly near impossible to determine if changes in those bars actually are keeping up with consumption rates.
-

shortonsense - Permanently Banned
- Posts: 3124
- Joined: Sat 30 Aug 2008, 03:00:00
Return to Peak oil studies, reports & models
Who is online
Users browsing this forum: No registered users and 5 guests