Donate Bitcoin

Donate Paypal


PeakOil is You

PeakOil is You

The one chart about oil's future everyone should see

General discussions of the systemic, societal and civilisational effects of depletion.

The one chart about oil's future everyone should see

Unread postby Graeme » Sun 09 Dec 2012, 17:30:21

The one chart about oil's future everyone should see

When people read about a long-term forecast of world oil supply--say, out to 2030--they often believe that the forecasters are merely incorporating our knowledge of existing fields and figuring out how much oil can be extracted from them over the forecast period. Nothing could be further from the truth. Much of the forecast supply has not yet been discovered or has no demonstrated technology which can extract or produce it economically. In other words, such forecasts are merely guesses based on the slimmest of evidence.

Perhaps the best ever illustration of this comes from a 2009 presentation made by Glen Sweetnam, a U.S. Energy Information Administration (EIA) official. The EIA is the statistical arm of the U.S. Department of Energy. The following chart from that presentation will upend any notion that we know exactly where all the oil we need to meet expected demand will come from.


Image

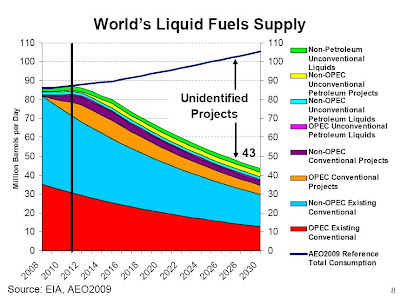
The chart shows that by 2030 world output of oil and other liquid fuels from current fields is expected to drop to 43 million barrels per day (mbpd), some 62 million barrels below projected demand of 105 mbpd. (Though prepared in 2009, the chart takes into account known projects expected to be producing by 2012.) This drop is consistent with the observed decline in the worldwide rate of production from existing fields of about 4 percent per year. Certainly, there will be more projects identified in the 18 years ahead. And, many people will say that we already have a large new resource of tight oil (often mistakenly referred to as shale oil) which can be extracted through hydraulic fracturing or fracking. But even if the optimists are correct--and there can be no guarantee that they will be--this source of oil will only add 3 to 4 million barrels of daily production. What Sweetnam's chart tells us is that we must find and bring into production the equivalent of five new Saudi Arabias between now and 2030 in order to meet expected demand even if the volume of tight oil reaches its maximum projected output. (The Saudis currently produce about 11.7 mbpd of oil and other liquids.)


resourceinsights
Human history becomes more and more a race between education and catastrophe. H. G. Wells.
Fatih Birol's motto: leave oil before it leaves us.
User avatar
Graeme
Fusion
Fusion
 
Posts: 13258
Joined: Fri 04 Mar 2005, 04:00:00
Location: New Zealand

Re: The one chart about oil's future everyone should see

Unread postby Plantagenet » Sun 09 Dec 2012, 17:36:45

Do you have EIA chart from a date more recent than 2009?

There is no point in discussing out-of-date charts from the EIA when the success of slickwater hydrofracturing in increasing oil producton in areas like the Bakken has significantly changed the EIA's view from what it was 3 years ago.
Never underestimate the ability of Joe Biden to f#@% things up---Barack Obama
-----------------------------------------------------------
Keep running between the raindrops.
User avatar
Plantagenet
Expert
Expert
 
Posts: 26627
Joined: Mon 09 Apr 2007, 03:00:00
Location: Alaska (its much bigger than Texas).

Re: The one chart about oil's future everyone should see

Unread postby dissident » Sun 09 Dec 2012, 18:31:06

The Bakken is a joke. Some CRI clown highballs the estimate to 24 billion barrels and people think there are trillions. The US consumes over 6.6 billion barrels per year so the whole Bakken with the unverified highball estimate from CRI is worth 3.6 years of US oil consumption. The Bakken is not a precedent for the world's oil reservoirs. Following your logic if the USGS estimate of 3.65 billion barrels of Bakken reserves become the unverified 24 billion claimed by CRI then every major oil field in the world could be scaled up by a factor of 7. This is BS, the major oil reservoirs such as Ghawar will not experience any increase from frakking technology.

So the OP highlights the main problem that frakking can't address and that is where to find 62 million barrels per day of oil production by 2030. Where are the dozens of Bakkens around the world? Nowhere.
dissident
Expert
Expert
 
Posts: 6458
Joined: Sat 08 Apr 2006, 03:00:00

Re: The one chart about oil's future everyone should see

Unread postby Plantagenet » Sun 09 Dec 2012, 19:31:14

dissident wrote:The Bakken is a joke.... The US consumes over 6.6 billion barrels per year so the whole Bakken with the unverified highball estimate from CRI is worth 3.6 years of US oil consumption.


Yes, of course, but in the real world oil production doesn't work that way Oil fields aren't drained in sequence so first one is used up in 3.6 years and then the next one is drained. In the real world a new oilfield like the Bakken is going to be producing oil for many decades.

Surely if we are going to discuss peak oil we should look at the most current and accurate data, rather then data from 2009. :)
User avatar
Plantagenet
Expert
Expert
 
Posts: 26627
Joined: Mon 09 Apr 2007, 03:00:00
Location: Alaska (its much bigger than Texas).

Re: The one chart about oil's future everyone should see

Unread postby meemoe_uk » Mon 10 Dec 2012, 15:42:54

Well yeah, but isn't the one chart peakers and running-outers have been peddling since the invention of graphs? - i.e. now is peak, the future is collapse. We've seen it all before, years ago.
User avatar
meemoe_uk
Tar Sands
Tar Sands
 
Posts: 948
Joined: Tue 22 May 2007, 03:00:00

Re: The one chart about oil's future everyone should see

Unread postby rockdoc123 » Mon 10 Dec 2012, 16:26:52

Fracted tight-shale oil will follow the same pattern as fracted tight-natural gas; explosive production increase followed by exponential decline rate, but worse. Oil, (thicker than natural gas) will fill in the fractures and pores in shale faster, requiring ever more multiple, expensive, time consuming fracts. The industry is ripe for a collapse, just like natural gas. Where will the rigs go to then? A museum?


Nonsense. The decline rates in oil shale wells is well established for a number of reservoirs including the Bakken. There is a range of declines and hence associated EUR/well but the type curve and EUR can be fairly well established from IP rate. The production profile is step initially but then flattens out and becomes hyperbolic. And the oil will not behave as you suggest, it is not heavy nor particularily viscous, generally with very high GOR. The fracs that occur are propped with porous and permeable sand or ceramic beads. This is the pathway by which the oil can migrate into the borehole. A pressure drop is induced via downhole pumps which allows for the flow. New wells are added in order to increase both production and reserves. An example would be a single well that might produce initially at 500 barrels per day and then decline to 150 barrels per day where it remains relatively flat for a number of years might end up with ultimate production of say 2 MMB. If instead 6 wells are drilled from the same wellpad with spacings of 200 metres you will have drained nearly a section of land (640 acres) with total reserves of 12 MMB and a flat production for a number of years of close to 1000 bpd.
And once again the gas industry is in tough times not because of a failure in shale gas but the exact opposite. It was so successful that the market was flooded with gas, storage facilities nearly filled year round and hence the commodity price dropped as supply and demand would dictate. This could happen to oil if they are as successful and would result in an even bigger split between WTI and Brent. The difference in this case is that oil is much more transportable than gas. At the right price buyers would acquire cheaper WTI and ship it to Europe. If enough export were to occur then you would see WTI and Brent converge again. So unlike gas I think there is a natural mechanism which will limit how bad of a crash North American oil producers might endure.
User avatar
rockdoc123
Expert
Expert
 
Posts: 7685
Joined: Mon 16 May 2005, 03:00:00

Re: The one chart about oil's future everyone should see

Unread postby Graeme » Mon 10 Dec 2012, 17:49:47

Rune Likvern begs to differ. And please read comments about TOD article by Rockman.

Findings from this in-depth study of time series for production from some individual wells:

Presently the estimated breakeven price for the “average” well in the Bakken formation in North Dakota is $80 - $90/Bbl In plain language this means that presently the commercial profitability for new wells is barely positive.

The “average” well now yields around 85 000 Bbls during the first 12 months of production and then experiences a year over year decline of 40% (+/-) 2%
The recent trend for newer “average” wells is one of a perceptible decline in well productivity (lower yields)

As of 2007 and also as of recent months, the total production of shale oil from Bakken, has shown exceptional growth and the (relatively high) specific average productivity (expressed as Bbls/day/well) has been sustained by starting up flow from an accelerating number of new wells

Now and based upon present observed trends for principally well productivity and crude oil futures (WTI), it is challenging to find support for the idea that total production of shale oil from the Bakken formation will move much above present levels of 0.6 - 0.7 Mb/d on an annual basis.


As of July 2012, data from the North Dakota Industrial Commission documented extraction (production) from 4 319 wells in the Bakken formation (which includes Bakken, Sanish, Three Forks and Bakken/Three Forks basins). Total reported production in July 2012 was around 610 000 Bbls/day with a specific average of 141 Bbls/day/well.

The production of shale oil/tight oil (which is not to be confused with oil shale; kerogen) is proclaimed by many to constitute a “revolution” and/or “game changer” for the global supplies of crude oil. Shale oil has unquestionably added valuable supplies during a period of tight global crude oil supplies.
Human history becomes more and more a race between education and catastrophe. H. G. Wells.
Fatih Birol's motto: leave oil before it leaves us.
User avatar
Graeme
Fusion
Fusion
 
Posts: 13258
Joined: Fri 04 Mar 2005, 04:00:00
Location: New Zealand

Re: The one chart about oil's future everyone should see

Unread postby Pops » Mon 10 Dec 2012, 18:01:13

Hamm (CLR CEO) said he thinks the avg will be 600kb per "well" in the Bakken and another CEO type guy said 300k and a third 700. No time to hunt the link at the moment, I think that was at Rigzone but the point is that it's pretty obvious no one has much of a clue no matter how the SEC defines "clue".

On Topic, I think the chart is relevant thought dated. The only thing that has changed since 09 is .8Mb/d of tight oil in the US. That leaves 61.2Mb/d or so to come up with by 2030.
The legitimate object of government, is to do for a community of people, whatever they need to have done, but can not do, at all, or can not, so well do, for themselves -- in their separate, and individual capacities.
-- Abraham Lincoln, Fragment on Government (July 1, 1854)
User avatar
Pops
Elite
Elite
 
Posts: 19746
Joined: Sat 03 Apr 2004, 04:00:00
Location: QuikSac for a 6-Pac

Re: The one chart about oil's future everyone should see

Unread postby Plantagenet » Mon 10 Dec 2012, 18:30:42

Pops wrote:On Topic....The only thing that has changed since 09 is .8Mb/d of tight oil in the US.


Things are a lot of other things that are completely different now then they were in 2009.
---Russia is now the #1 oil producer
---production in Iraq is growing rapidly now that foreign firms are working there.
---North Sea production has fallen for Norway and Scotland in spite of large Norweigan efforts
---Mexican production collapse at Cantarell occurred between 2009-2012----and some new production is now coming on line. Mexico is also debating allow US frakking companies to work in Mexico---an enormous change.
---US Bakken and Eagle Ford oil production are growing to the point that the EIA predicts US production will continue to grow until the US is the world's leading oil producer---and that would be a gigantic change.
User avatar
Plantagenet
Expert
Expert
 
Posts: 26627
Joined: Mon 09 Apr 2007, 03:00:00
Location: Alaska (its much bigger than Texas).

Re: The one chart about oil's future everyone should see

Unread postby Graeme » Mon 10 Dec 2012, 18:44:49

Monthly oil production data reported by the US Energy Information Agency (EIA) offers several advantages over the equivalent data published by the International Energy Agency (EIA). First and foremost, the EIA report natural gas liquids separately enabling a more in depth analysis of underlying crude oil and condensate (C+C) production, they report data for a larger number of countries and make data available to download as XL spread sheets.

Asian oil production (C+C+NGL) has been on a plateau of 8 million bpd for over a decade. FSU oil production has been on a plateau of just over 13 million bpd for 3 years. African oil production has been on a plateau of 10 million bpd for 6 years and S American oil production has been on a plateau of 7 million bpd for over a decade. That is 38 million bpd of global production, or just under half, that has been static for many years.

European oil production (C+C+NGL), centered in the North Sea is in steep decline, down from a plateau of 7 million bpd a decade ago to 3.2 million bpd in August 2012.

The loss of European production has been compensated by rising production in N America and the Middle East. Rising production in N America comes mainly from unconventional oil - shale oil and tar sands.

Deducting N American shale oil and Canadian tar sands production from global C+C shows that the latter has been on a plateau of just over 73 million bpd since May 2005 with a near-term peak of 73.3 million bpd in April 2012. All of the growth in global total liquid fuel supply since May 2005 has come from natural gas liquids (NGL), unconventional oil, refinery processing gains and from biofuels.


Image

Figure 1 Global C+C less tar sands and shale oil (US Bakken, US Eagle Ford and Canadian Bakken) has been on a bumpy plateau of just over 73 million bpd since May 2005. In May 2005 Iraqi production was just recovering from conflict and has since come back strongly. Currently Sudan is offline, Syria is all but off line and Iran is being squeezed out of the market by sanctions. The ups and downs reflect masterly control of supply by OPEC. Data sources: Energy Information Agency, National Energy Board Canada, Statistics Canada, North Dakota Drilling and Production Statistics, Railroad Commission of Texas. The chart includes a 150,000 bpd assumption for Canadian Bakken 2011/12.

TOD
Human history becomes more and more a race between education and catastrophe. H. G. Wells.
Fatih Birol's motto: leave oil before it leaves us.
User avatar
Graeme
Fusion
Fusion
 
Posts: 13258
Joined: Fri 04 Mar 2005, 04:00:00
Location: New Zealand

Re: The one chart about oil's future everyone should see

Unread postby Pops » Tue 11 Dec 2012, 08:44:10

The point of the thread is that there is 62Mb/d of production required to meet increasing demand and decline of existing production over the next 20 years and it isn't clear where that will come from, certainly not Wyoming. Greame's chart is a good illustration of the effect fracking is having on the real world as opposed to the spin-world.
The legitimate object of government, is to do for a community of people, whatever they need to have done, but can not do, at all, or can not, so well do, for themselves -- in their separate, and individual capacities.
-- Abraham Lincoln, Fragment on Government (July 1, 1854)
User avatar
Pops
Elite
Elite
 
Posts: 19746
Joined: Sat 03 Apr 2004, 04:00:00
Location: QuikSac for a 6-Pac

Re: The one chart about oil's future everyone should see

Unread postby Econ101 » Tue 11 Dec 2012, 11:15:06

That article is abosulte complete nonesense. As for The Bakken, it contains so much oil deniers cant believe it. Just think what that crack pot that proposed peak oil would think if he saw the Bakken. He would be flabergasted without even seeing the tremendous development going on world wide. Do you think he would be surprised or would he say the Bakken has no oil? His calculations and writings show he was completely ingnorant of the store of oil in the earth yet deniers cling to his totally debunked theory.
Econ101
Lignite
Lignite
 
Posts: 322
Joined: Sat 01 Sep 2012, 07:47:56

Re: The one chart about oil's future everyone should see

Unread postby AirlinePilot » Tue 11 Dec 2012, 15:29:29

Econ101 wrote: As for The Bakken, it contains so much oil deniers cant believe it.


It doesnt matter how much oil it contains.

I wonder when folks are going to understand this very important point. This always seems to blind people to the reality of the situation.
User avatar
AirlinePilot
Moderator
Moderator
 
Posts: 4378
Joined: Tue 05 Apr 2005, 03:00:00
Location: South of Atlanta

Re: The one chart about oil's future everyone should see

Unread postby AdTheNad » Tue 11 Dec 2012, 16:27:00

AirlinePilot wrote:
Econ101 wrote: As for The Bakken, it contains so much oil deniers cant believe it.


It doesnt matter how much oil it contains.

I wonder when folks are going to understand this very important point. This always seems to blind people to the reality of the situation.

Econ101 will never understand that particular point. He has been very clear on the matter.
AdTheNad
Coal
Coal
 
Posts: 433
Joined: Wed 22 Dec 2010, 07:47:48

Re: The one chart about oil's future everyone should see

Unread postby Beery1 » Tue 11 Dec 2012, 16:56:33

Econ101 wrote:As for The Bakken, it contains so much oil deniers cant believe it.


http://www.youtube.com/watch?v=mgSYF0QIcCw
"I'm gonna have to ask you boys to stop raping our doctor."
Beery1
Tar Sands
Tar Sands
 
Posts: 690
Joined: Tue 17 Jan 2012, 21:31:15

Re: The one chart about oil's future everyone should see

Unread postby copious.abundance » Wed 12 Dec 2012, 01:23:41

AirlinePilot wrote:
Econ101 wrote: As for The Bakken, it contains so much oil deniers cant believe it.


It doesnt matter how much oil it contains.

I wonder when folks are going to understand this very important point. This always seems to blind people to the reality of the situation.

For once I agree with you 100% AP. It does not really matter how much the Bakken contains, and people seem blind to the reality of the situtation.

And here's the reality of the situation. :lol: Up, up, and away!! :lol:

Image
Stuff for doomers to contemplate:
http://peakoil.com/forums/post1190117.html#p1190117
http://peakoil.com/forums/post1193930.html#p1193930
http://peakoil.com/forums/post1206767.html#p1206767
User avatar
copious.abundance
Fission
Fission
 
Posts: 9589
Joined: Wed 26 Mar 2008, 03:00:00
Location: Cornucopia

Re: The one chart about oil's future everyone should see

Unread postby copious.abundance » Wed 12 Dec 2012, 01:25:29

And if that weren't enough, here's what's happening in Texas! 8O

Image
Stuff for doomers to contemplate:
http://peakoil.com/forums/post1190117.html#p1190117
http://peakoil.com/forums/post1193930.html#p1193930
http://peakoil.com/forums/post1206767.html#p1206767
User avatar
copious.abundance
Fission
Fission
 
Posts: 9589
Joined: Wed 26 Mar 2008, 03:00:00
Location: Cornucopia

Next

Return to Peak Oil Discussion

Who is online

Users browsing this forum: No registered users and 34 guests