

Right now our fact numero uno is:
1. Oil is a finite resource on a human time scale, unimpeded extraction typically follows a bell-shaped curve with a maximum followed by terminal decline.
The first part; oil is finite, I'm pretty sure is not in doubt.
But the second part, apologies to Hubbert, is wrong I think. If not wrong from a 500 year historical perspective, from an up close, limited attention span, human perspective it has proven to be a poor predictor. And even if it is ultimately right, what use is it as a basic fact since there is no such situation as "unimpeded extraction"?
The biggest problem with Hubbert's method is that to guess the midpoint of extraction (and so the peak) one must first guess the total amount of oil that will ever be extracted and only then plot out a nice smooth curve.
Making that prediction of the ultimate resource has been done at least 2 ways, first simply by looking at discovery; since you can't pump what you can't find, the amount discovered surely indicates the amount that can be extracted. I'll talk more about discovery later.
The second way is called the "Hubbert Linearization", a simple formula that divides the amount produced in a period by the cumulative amount produced to that point. A series of such periods are then plotted against cumulative production and where a trendline intersects the x axis is the estimate of total.
Here is a post by Stanifod back in '05 and the chart with Staniford's fit estimating something under 2.4Tbbls in yellow, Dryfesses in pink and (I assume) his guess at how a couple of others would look:
BTW, my math stops somewhere around Pie Are Square so please correct it at any point.
--
Sticking with the linearization method, the first problem I have is the the resulting URR derived is assumed to be a relatively static number - otherwise what good is it? But it isn't, it is derived from past production and production methods change over time due to technology, demand, oil price. Even worse, depending on which particular year you start the trendline gives pretty different estimates of ultimate.
Here is a great chart from Here (oil+gas in tons of oil equivalent) showing a range of ultimates depending on the starting year of the trend:
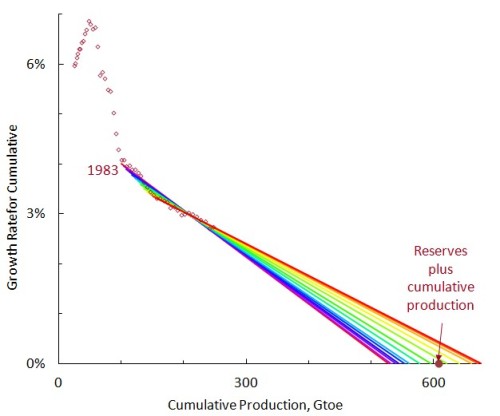
--
So a little about about backdating reserve growth. First, reserve numbers are always influenced by economic and political considerations so should rightly be suspect. But It is pretty well the received wisdom that discovery peaked back in 1964 or some such. For my math impaired brain, the chart showing reserves having peaked was the clincher - after all you can't drill what you can't find.
Here is a comparison of the amounts of original discoveries, and reserve additions either backdated to the the date the region was originally discovered or the date of the reserve addition.
The idea that discovery has peaked is pretty dependent on backdating reserve growth. That is, ascribing reserve additions in known fields to the date the field was first discovered rather than the date the new technology or price increased the reserve. So if field A initially was assigned a URR of 1 million barrels in 1950 and an improvement in technology in 2000 made it possible to extract 2 MM barrels, the additional "discovery" is credited to 1950 rather than 2000.
Opponents of that view say this gives a false impression of the role of increasing technology and ongoing "discoveries" above, below and around fields know for years.
--
What Hubbert's peak doesn't take into account is:
• Technology that increases the URR
• Scarcity pricing that increases the URR
• Non-homogeneity of the resource that affects flow rates - this is about x-heavy/tar/etc and is relly a separate topic from C+C peak)
Now, as Keith has been saying, even huge changes in URR don't really make for huge changes in PO date. At current extraction rates, a simple logistics curve shows only a 25 year difference in the peak date between a URR of 2 trillion barrels and 4 trillion barrels. Campbell and Laherrere's SciAm paper in '98 guessed 1.8Tb I think, giving a peak date around 2005, even if they were off by 100% that makes a simple Hubbert peak come in at 2030.
There are also some countries, in fact a lot, that show a peak way before 50% of their ultimate production. Texas (who thinks it's a country) was thought to have peaked at almost 60% of URR but with this latest flush from tight oil might wind up moving it's peak back - or maybe way forward, though I doubt that. If someone would like to look that up and find a citation for how many regions appear to have peaked before 50% it would be great.
… Anyway, I don't have the patience to keep saving this to work on later so I'll just throw it up and see what you-all think, tear it up!
Keep it relevant to the point "bell shaped curve" in our Fact Number One.
www.dtic.mil/cgi-bin/GetTRDoc?AD=ADA488967
http://www.econbrowser.com/archives/201 ... nd_pr.html
https://docs.google.com/viewer?url=http ... p12109.pdf
http://www.graphoilogy.com/search/label ... earization
http://www.hubbertpeak.com/fleay/climaxingoil/


