Donate Bitcoin

Donate Paypal


PeakOil is You

PeakOil is You

Using Global CO2 Emissions Data to Calculate Hubbert's Curve

General discussions of the systemic, societal and civilisational effects of depletion.

Using Global CO2 Emissions Data to Calculate Hubbert's Curve

Unread postby xraymike79 » Sat 26 Apr 2014, 13:18:55

[...]

Image

Conclusions

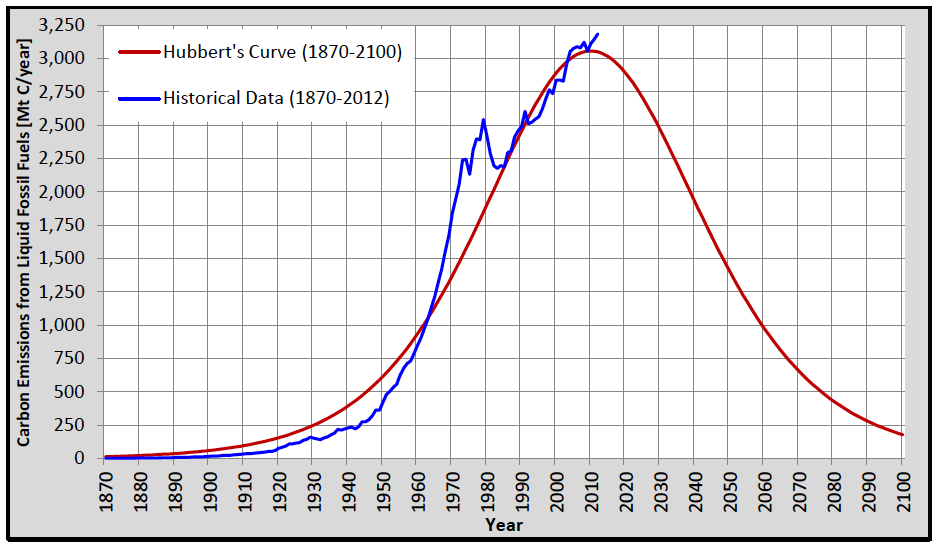
Based on CDIAC’s global data of carbon emissions from liquid fossil fuels (i.e. predominantly petroleum) and Marion King Hubbert’s method of calculating the oil production curve, we have arrived at a theoretical emissions peak of carbon from liquid fossil fuels (i.e. oil production peak) in 2010.

Compared to earlier forecasts of oil-geologists and other experts using Hubbert’s methodology, the calculations based on CDIAC data get quite close to the mark. Most of these experts (like Collin Campbell, Jean Laherrère, Kenneth Deffeyes and Matthew Simmons) forecast peak-oil between 2005 and 2010, so the CDIAC data turn out to be a fairly reliable source for this purpose.

Theoretically, we’re already 4 years past the peak, although historical data still show growth. This is very well possible for a limited period of time. Given the frantic drilling and fracking spree we’ve seen since about 2007, it’s not even surprising. Extraction methods have improved as well over the last decade or so: horizontal drilling, hydraulic fracturing, deep-sea drilling, more accurate 3D soundings of geological formations, etc. The much higher oil price has also made it worthwhile to drill for harder-to-get oil. So, the ultimately recoverable amount of oil has increased indeed (though I don’t know by how much) and this is not (yet) reflected in the historical data.

Recent Developments

Since a few years, there has been a lot of talk that there are so much fossil fuel reserves left that we can only responsibly burn about one third of them (leaving two-thirds in the ground) in order to keep global warming below 2°C (IEA, 2012). This also implies that the shares of fossil fuel companies are over-valued by up to 80% (Carbon Tracker, 2012; Carbon Tracker, 2013). However, there are several caveats against this analysis:

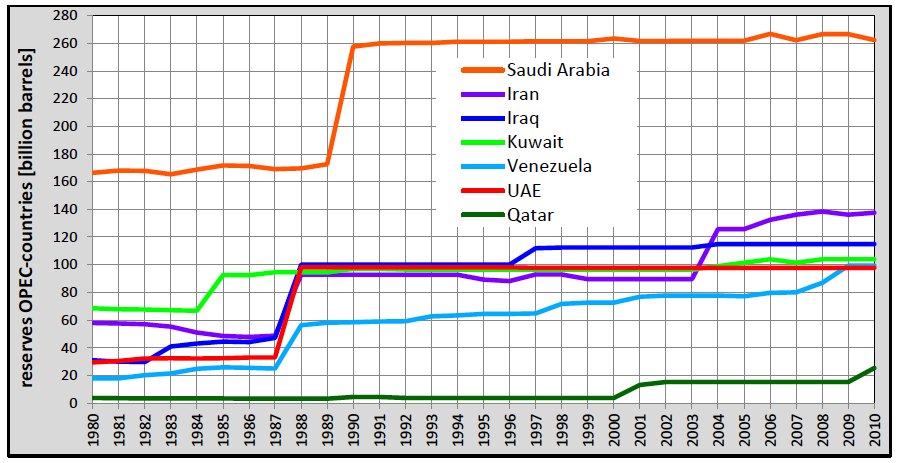
The reserves are based on stated reserves of fossil fuel companies and governments, but we don’t know to what extent these reserves are overstated. Of the OPEC-countries it’s quite obvious that (for political motives) they overstated their reserves dramatically between 1987 and 1990. The sudden jumps in stated reserves were not accompanied by announcements of newfound oil fields. Also, it doesn’t add up that oil reserves have remained virtually constant during decades of high rates of oil production and low rates of new discoveries:
Image
Source: own compilation of U.S. Energy Information Administration data (EIA, 2013)

- It’s not the amount of fossil fuel reserves that counts; it’s the rate at which they can be extracted. The big oilfields with high quality and easy to get petroleum are mostly depleted. We are now looking for ever smaller fields in ever harder to reach locations, like the ocean floors and the arctic. When it’s ever harder to get the oil, this will result in a slowdown of the rate of extraction (i.e. going down the other side of Hubbert’s curve).

- The Energy Return on Energy Invested (EROEI) has already gone down seriously. The EROEI is an analysis of how much energy it takes to produce fossil energy (produce materials and operate machinery needed to construct the facilities to drill for oil and get it to the market, like drilling rigs, pipelines, oil tankers, refineries, etc.) and how much energy you get from all this. The EROEI used to be 100:1 in the 1930s – 1950s. Talking about tar sands the EROEI is already down to something like 5:1. This means that for every 5 barrels of oil (equivalent) one has to be invested into getting it, 4 are left as “profit”. Once it takes one barrel of oil to get one barrel of oil, there won’t be any profit left and it’s pointless to continue. Actually well before this point (say 2:1) because an oil company needs to sell at least some oil to pay for the investments in wages and equipment.

- The cost of oil extraction is already such that the oil price has to be above $100/barrel in order to be profitable. On the other hand, how high a fossil fuel price can the world economy afford in order to function healthily? We’ve seen the world economy crash into the Great Recession in 2008, when the oil price soared to $147/barrel (I daresay it wasn’t exactly a housing bubble…) and the price is again hovering around $100/barrel. No wonder economic growth doesn’t want to pick up! Oil consumption simply responds to the economic law of supply and demand. When oil gets too expensive, people will turn to cheaper alternatives and oil consumption goes down (the other side of Hubbert’s curve) just the same.

So there are many ways to look at peak-oil (environmental, geological, economical, social, etc.). One way doesn’t exclude the other, so I surely don’t want to contribute to infighting between peak-oilists and environmentalists. Both are right and allies to the same cause: we have to think hard and take swift action to create a sustainable way of living in harmony with the world wide web of life on our planet, in order to prove that human intelligence was not an evolutionary error.

Read full essay here:
http://collapseofindustrialcivilization ... -yourself/
User avatar
xraymike79
Wood
Wood
 
Posts: 22
Joined: Sat 26 Apr 2014, 12:41:57

Re: Using Global CO2 Emissions Data to Calculate Hubbert's C

Unread postby Pops » Sat 26 Apr 2014, 17:10:20

Thanks for posting Mike, I've been reading COIC for a while but haven't gotten around to linking anything here. This is a good start.
The legitimate object of government, is to do for a community of people, whatever they need to have done, but can not do, at all, or can not, so well do, for themselves -- in their separate, and individual capacities.
-- Abraham Lincoln, Fragment on Government (July 1, 1854)
User avatar
Pops
Elite
Elite
 
Posts: 19746
Joined: Sat 03 Apr 2004, 04:00:00
Location: QuikSac for a 6-Pac

Re: Using Global CO2 Emissions Data to Calculate Hubbert's C

Unread postby farmlad » Sat 26 Apr 2014, 23:20:01

Maybe I'm missing something but this article does not seem to take into account the power of biology to either capture and store carbon or also to release it back into the atmosphere again as could be happening today because of the warmer oceans or more grass fires, etc.
farmlad
Peat
Peat
 
Posts: 94
Joined: Sun 12 Jan 2014, 21:02:23

Re: Using Global CO2 Emissions Data to Calculate Hubbert's C

Unread postby xraymike79 » Sun 27 Apr 2014, 00:53:49

farmlad wrote:Maybe I'm missing something but this article does not seem to take into account the power of biology to either capture and store carbon or also to release it back into the atmosphere again as could be happening today because of the warmer oceans or more grass fires, etc.


This article is more of a technical how-to on calculating Hubbert's curve for industrial civilization by using global emissions data, since the "oil reserves and production data of many countries and oil companies are kept secret." The peak was apparently in 2010 and we're headed for a steep decline as we frantically exploit unconventional energy sources to keep the rate of extraction from falling.

In order to keep your sanity, I would suggest not trying to wrap your mind around what we have done to the chemistry of the planet's biosphere.

From Heinberg:
http://www.psmag.com/navigation/nature- ... ent-79381/

…Lower energy profits from unconventional oil inevitably show up in the financials of oil companies. Between 1998 and 2005, the industry invested $1.5 trillion in exploration and production, and this investment yielded 8.6 million barrels per day in additional world oil production. But between 2005 and 2013, the industry spent $4 trillion on exploration and production, yet this more-than-doubled investment produced only 4 mb/d in added production.

It gets worse: All net new production during the 2005-13 period came from unconventional sources; of the $4 trillion spent, it took $350 billion to achieve a bump in production. Subtracting unconventionals from the total, world oil production actually fell by about a million barrels a day during these years. That means the oil industry spent over $3.5 trillion to achieve a decline in overall conventional production.

Last year was one of the worst ever for new discoveries, and companies are cutting exploration budgets. “It is becoming increasingly difficult to find new oil and gas, and in particular new oil,” Tim Dodson, the exploration chief of Statoil, the world’s top conventional explorer, recently told Reuters. “The discoveries tend to be somewhat smaller, more complex, more remote, so it is very difficult to see a reversal of that trend…. The industry at large will probably struggle going forward with reserve replacement.”

The costs of oil exploration and production are currently rising at about 10.9 percent per year, according to Steve Kopits of the energy analytics firm Douglas-Westwood. This is squeezing the industry’s profit margins, since it’s getting ever harder to pass these costs on to consumers.
In 2010, The Economist magazine discussed rising costs of energy production, musing that “the direction of change seems clear. If the world were a giant company, its return on capital would be falling.”

Tim Morgan, formerly of the London-based brokerage Tullett Prebon (whose customers consist primarily of investment banks), explored the average Energy Return on Energy Investment (EROEI) of global energy sources in one of his company’s Strategy Insights reports, noting: “For 2020, our projected EROEI (of 11.5:1) [would] mean that the share of GDP absorbed by energy costs would have escalated to about 9.6 percent from around 6.7 percent today. Our projections further suggest that energy costs could absorb almost 15 percent of GDP (at an EROEI of 7.7:1) by 2030…. [T]he critical relationship between energy production and the energy cost of extraction is now deteriorating so rapidly that the economy as we have known it for more than two centuries is beginning to unravel.”
From an energy accounting perspective, the situation is in one respect actually worst in North America—which is deeply ironic: It’s here that production has grown most in the past five years, and it’s here that the industry is most boastful of its achievements. Yet the average energy profit ratio for U.S. oil production has fallen from 100:1 to 10:1, and the downward trend is accelerating as more and more oil comes from unconventional sources.

These profit ratios might be spectacular in the financial world, but in energy terms this is alarming. Everything we do in industrial societies—education, health care, research, manufacturing, transportation—requires energy. Unless our investment of energy in producing more energy yields an average profit ratio of roughly 10:1 or more, it may not be possible to maintain an industrial (as opposed to an agrarian) mode of societal organization over the long run....
User avatar
xraymike79
Wood
Wood
 
Posts: 22
Joined: Sat 26 Apr 2014, 12:41:57

Re: Using Global CO2 Emissions Data to Calculate Hubbert's C

Unread postby sparky » Sun 27 Apr 2014, 01:02:10

.
"It’s not the amount of fossil fuel reserves that counts; it’s the rate at which they can be extracted"

let's hammer it in again

"It’s not the amount of fossil fuel reserves that counts; it’s the rate at which they can be extracted"

this being said and I totaly are on the same page as you ,
it is needful to note that there is no inflection in the carbon curve as yet
User avatar
sparky
Intermediate Crude
Intermediate Crude
 
Posts: 3587
Joined: Mon 09 Apr 2007, 03:00:00
Location: Sydney , OZ

Re: Using Global CO2 Emissions Data to Calculate Hubbert's C

Unread postby Quinny » Sun 27 Apr 2014, 02:36:10

This article says a lot of things I've been wanting to say for a long time but never got round to formulating it. It also uses one of my favourite tools, even better than Lotus 1-2-3. :)

Thanks.
Live, Love, Learn, Leave Legacy.....oh and have a Laugh while you're doing it!
User avatar
Quinny
Intermediate Crude
Intermediate Crude
 
Posts: 3337
Joined: Thu 03 Jul 2008, 03:00:00

Re: Using Global CO2 Emissions Data to Calculate Hubbert's C

Unread postby ROCKMAN » Sun 27 Apr 2014, 15:04:12

"we have arrived at a theoretical emissions peak of carbon from liquid fossil fuels (i.e. oil production peak) in 2010." I guess I missed the entire logic of the model. So coal hasn't contributed to GHG emissions and the record amount of coal burning on the last 20 years? And the assumption is that despite decades of constant increases in coal consumption will come to a sudden end because we are rapidly depleting liquid hydrocarbons. And thus GHG emissions from coal will cease. Of course, there's a few other blanks as has been mentioned: so the increase in burning crops (as well as clearing out rain forests for planting have made significant contribution? Obvious these folks have never driven thru the south when they are burning many hundreds of thousands of acres of sugar cane.

I gotta be missing something.

Just found this here: http://books.google.com/books?id=8Z85BO ... on&f=false

Estimated cumulative carbon release from the 1700's to 2003 is about half of the carbon releases from all fossil fuel sources during the period.
User avatar
ROCKMAN
Expert
Expert
 
Posts: 11397
Joined: Tue 27 May 2008, 03:00:00
Location: TEXAS

Re: Using Global CO2 Emissions Data to Calculate Hubbert's C

Unread postby xraymike79 » Mon 28 Apr 2014, 10:33:55

Question: How does the CDIAC separate out the CO2 emissions from the various fossil fuel sources as well as natural background emissions from fires, volcanoes, etc? Is there a link at their site that explains this?

Answer from Hans:

Hi Mike,

CDIAC uses cement production data from the USGS (US Geological Survey) and the UN energy statistics. CDIAC focuses on CO2 from fossil fuels, so it excludes CO2 emissions from other sources, like volcanoes, forest fires, land degradation, etc. It also excludes other greenhouse gases, like methane, CFCs, nitrous oxides, aerosols, etc.
Under the UNFCCC (United Nations Framework Convention on Climate Change) agreements, all countries have an obligation to supply national data related to climate change. In this way the UNFCCC receives historical import, export and refinery data that mention the type of fossil fuel, so it's not that difficult to split them up into solid, liquid and gaseous.
The latest report on climate change of Working Group 1 (WG-I), of the 5th Assessment Report (AR5) of the IPCC (September 2013) shows the following graph on page 487:

Image

In the explanation you see CDIAC appear as a data source. It also says that CDIAC gets its data from the USGS and the UN energy statistics (which is a discovery for me as well).
Here's a link to the UN energy statistics: (http://unstats.un.org/UNSD/energy/yearbook/default.htm).

Best,
Hans
User avatar
xraymike79
Wood
Wood
 
Posts: 22
Joined: Sat 26 Apr 2014, 12:41:57


Return to Peak Oil Discussion

Who is online

Users browsing this forum: No registered users and 27 guests