I have been looking for this graph for some time. Today it showed up on the front page!
Picture worth many words.


PeakOil is You
![]() by MD » Wed 05 Nov 2014, 09:46:32
by MD » Wed 05 Nov 2014, 09:46:32


![]() by ROCKMAN » Wed 05 Nov 2014, 11:07:32
by ROCKMAN » Wed 05 Nov 2014, 11:07:32

![]() by ROCKMAN » Wed 05 Nov 2014, 13:31:20
by ROCKMAN » Wed 05 Nov 2014, 13:31:20
![]() by MD » Wed 05 Nov 2014, 15:08:35
by MD » Wed 05 Nov 2014, 15:08:35
![]() by MD » Thu 06 Nov 2014, 07:12:40
by MD » Thu 06 Nov 2014, 07:12:40
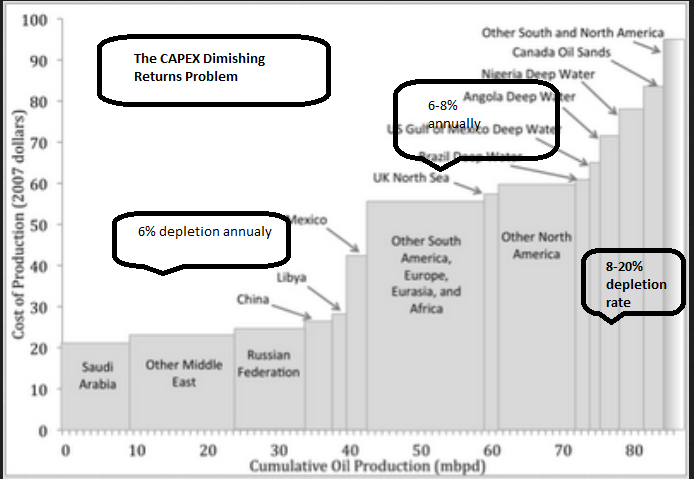
dashster wrote:I see Canadian Oil Sands on the chart. Not sure what they are referring to with regard to depletion rate and Oil Sands.
![]() by ROCKMAN » Thu 06 Nov 2014, 09:16:56
by ROCKMAN » Thu 06 Nov 2014, 09:16:56
![]() by MD » Fri 07 Nov 2014, 05:19:23
by MD » Fri 07 Nov 2014, 05:19:23
ROCKMAN wrote:
You see what I’m saying now: the chart isn’t representing what anyone thinks it’s saying regardless how they interpret “Cost of Production”. Either way the chart is grossly misleading IMHO.
![]() by MD » Sat 08 Nov 2014, 04:23:50
by MD » Sat 08 Nov 2014, 04:23:50
![]() by ROCKMAN » Sat 08 Nov 2014, 11:00:20
by ROCKMAN » Sat 08 Nov 2014, 11:00:20
![]() by Keith_McClary » Sun 09 Nov 2014, 01:10:55
by Keith_McClary » Sun 09 Nov 2014, 01:10:55


![]() by MD » Sun 09 Nov 2014, 10:24:06
by MD » Sun 09 Nov 2014, 10:24:06
ROCKMAN wrote:MD - "I'm still convinced of its accuracy though." Fair enough. So you believe the KSA and Russia have undeveloped oil reserves they can drill up for $20/bbl.
![]() by ROCKMAN » Sun 09 Nov 2014, 10:32:07
by ROCKMAN » Sun 09 Nov 2014, 10:32:07
![]() by MD » Sun 09 Nov 2014, 10:39:21
by MD » Sun 09 Nov 2014, 10:39:21
ROCKMAN wrote:A) the price required to PRODUCE existing oil reserves and B) the price required to DEVELOP new oil reserves. The curve is labeled "Cost of Supply". So which is it...A or B?

![]() by ROCKMAN » Sun 09 Nov 2014, 11:12:22
by ROCKMAN » Sun 09 Nov 2014, 11:12:22
![]() by MD » Sun 09 Nov 2014, 11:21:56
by MD » Sun 09 Nov 2014, 11:21:56
ROCKMAN wrote:...I suspect few folks realize how much current production is economical to produce from wells that will never recover the investment even at $100/bbl.
![]() by ROCKMAN » Sun 09 Nov 2014, 12:20:40
by ROCKMAN » Sun 09 Nov 2014, 12:20:40
![]() by Keith_McClary » Sun 09 Nov 2014, 17:23:11
by Keith_McClary » Sun 09 Nov 2014, 17:23:11
They are all from proprietary data shops so we don't get to see what goes into these. (Do paying customers get much more?)ROCKMAN wrote:You posted the chart so I'll leave it to you to tell us which of the above scenarios is being offered.
Whatever their methods, it would be interesting to see the same graphs for different years.MD wrote:The wedge, however, is moving.
![]() by ROCKMAN » Sun 09 Nov 2014, 18:23:38
by ROCKMAN » Sun 09 Nov 2014, 18:23:38
Users browsing this forum: No registered users and 32 guests
