You cannot explain everything away with your cheap debt theory. The number of households grew. The amount of commercial office space has grown. The amount of goods and services provided to consumers has grown. Also, your 27% figure for LED bulbs is out of date. According to the EIA, as of 2018 LED bulb shipments hit
65% of all bulb shipments. Also, the drop in per capita electricity consumption exactly matches the drop in electricity consumption for lighting:
The figure below plots U.S. residential electricity consumption per capita 1990-2015. Consumption dipped significantly in 2012 and has remained flat, even as the economy has improved considerably.
Broad Decreases
The decrease has been experienced broadly, in virtually all U.S. states. The figure below shows that between 2010 and 2015, per capita residential electricity consumption declined in 48 out of 50 states. This pattern stands in sharp contrast to previous decades. During the 1990s and 2000s, for example, residential electricity consumption per capita increased by 12% and 11%, respectively, with increases in almost all states. Previous decades experienced much larger increases.
Energy-Efficient Lighting
So what is different? Energy-efficient lighting. Over 450 million LEDs have been installed to date in the United States, up from less than half a million in 2009, and nearly 70% of Americans have purchased at least one LED bulb. Compact fluorescent lightbulbs (CFLs) are even more common, with 70%+ of households owning some CFLs. All told, energy-efficient lighting now accounts for 80% of all U.S. lighting sales.
Is this really big enough to matter? Yes! Suppose that between LEDs and CFLs there are now one billion energy-efficient lightbulbs installed in U.S. homes. If operated 3 hours per day, this implies savings of 50 million megawatt hours per year, or 0.16 megawatt hours per capita, about the size of the decrease above. Thus, a simple back-of-the-envelope bottom-up calculation yields a similar decrease to the decline visible in aggregate data.
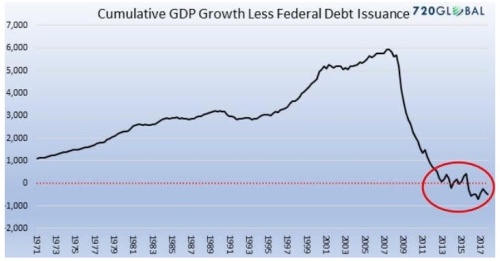
Evidence of a Decline in Electricity Use by U.S. HouseholdsWhat exactly do you think the US consumer did with all that extra debt? They used it to purchase goods and services. These goods and services require energy to be produced. I mean look at
this. US consumer spending went from around $10.5 trillion in 2007 to $13.4 trillion last year. All that debt sure buys alot of widgets and services.
The oil barrel is half-full.


